We prioritize collective, evidence-based learning to achieve equitable and enduring solutions

1. Tropical deforestation

In 2025, the world lost 6.7 million hectares (Mha)[1] of tropical tree cover due to deforestation[2], an area roughly the size of Ireland. Though this represented a 14% decrease from the year prior, the scale of loss continues to threaten the many services that forests provide, including water security, biodiversity, food and medicine, and climate regulation.

A large share of tropical deforestation is concentrated in a relatively small number of major forest geographies, with the Congo Basin, Indonesia, and the Brazilian Amazon together accounting for 42% in 2025.

Under the Glasgow Leaders’ Declaration on Forests and Land Use, 145 countries have committed to halt and reverse deforestation by 2030[3], positioning forests as central to limiting global warming, conserving biodiversity, and supporting sustainable development goals. Although tropical deforestation slowed in 2025, the decline was driven largely by reductions in Brazil and masks concerning trends elsewhere, including in the Congo Basin. Overall forest loss remains high, as incentives continue to favor deforestation over standing forests.


Why it matters

Meeting global climate and biodiversity goals while supporting the rights and well-being of people requires eliminating deforestation in the tropics and its long-term impacts, including carbon emissions, biodiversity loss – and all too often, the displacement, loss of livelihoods, and destruction of cultural and spiritual sites. But halting and reversing deforestation requires collective action and systemic change.

Photo by Kynan Tegar

The Brazilian Amazon lost 1 Mha of forests in 2025, down about 33% from the previous year and among the lowest levels on record.

In the mid-2000s, the Brazilian government took steps to enforce forest protection laws, and deforestation plummeted, proving to the world that forest protection and economic growth could go hand in hand. But this progress was reversed in the mid-2010s [4], coinciding with the erosion of environmental protections; rights of Indigenous Peoples, Quilombola, and local communities and enforcement against illegal activity. More recent data is more encouraging [5], likely due in large part to intensified enforcement efforts: environmental violation notices increased by 81% and fines by 63% in 2023–2025 compared to 2020–2022, signaling that Brazil is once again charting a path toward more just and sustainable land use.

The Congo Basin lost 862,000 ha of forests in 2025, with the Democratic Republic of the Congo accounting for most of the region’s deforestation.

In the Congo Basin, small-scale agriculture and charcoal production are major direct drivers of deforestation, with mining and industrial logging also contributing to forest and nature loss[6]. These pressures are shaped by deeper forces, including poverty, population growth, weak governance, and conflict.

Forest loss in the Congo Basin has increased over the past decade, especially in the Democratic Republic of the Congo and Cameroon. Because most of the primary drivers of forest loss are closely tied to livelihoods and energy access, effective solutions must also be tailored to these socioeconomic realities — supporting rural incomes, food security, and affordable alternatives alongside stronger forest protection.

Deforestation in Indonesia was about 895,000 ha in 2025, remaining well below the highs of the mid-2010s. However, recent forest loss levels show that this progress remains fragile.

Indonesia has kept deforestation relatively low in recent years through a combination of business action and government policy[7]. Following the catastrophic forest fires of 2015, the country instituted a moratorium on clearing of primary forests and peatland and introduced broader governance reforms. Voluntary commitments in the palm oil and pulp sectors have also helped limit forest clearing, although recent pressures from agricultural expansion and mining remain important risks.

Deforestation is defined as the permanent conversion of natural forest cover to new, non-forest land uses[8]. To estimate deforestation, Global Forest Watch uses a proxy that combines tree cover loss[9], drivers of tree cover loss[10], and humid tropical primary forest extent[11]. The proxy identifies deforestation as tree cover loss from shifting cultivation within humid tropical primary forests, as well as all loss driven by permanent agriculture, hard commodities, and settlements and infrastructure, at 30% tree canopy density, for the tropics, legal Amazon, and by country. This is designed to exclude forest loss that is temporary (for example, due to fires or natural disturbances) or that reflects harvesting cycles in planted forests. Data for the tropics is filtered to the FAO tropical ecozone.

2. Tropical tree cover gain

Between 2000 and 2020, tropical forest countries gained 38.5 Mha of tree cover.[12] However, the world is not on track[13] to deliver on global restoration pledges including the Bonn Challenge, a commitment to restore 350 Mha of lost and degraded forests worldwide by 2030.[14]

On average, 27% of tropical tree cover gain between 2000 and 2020 took place in FPC focal geographies, far lower than the proportion of deforestation in these same geographies (55%). This is trending downward: from 2015-2020, less than one-fifth of all tropical tree cover gain took place in the Brazilian Amazon, Congo Basin, or Indonesia.

Why it matters

Forest restoration – interventions that aim to improve ecological functionality and enhance human well-being in degraded forest landscapes – is complementary to protecting tropical forests, though it cannot fully reverse the impacts of deforestation on climate, biodiversity, and communities. Forest restoration can improve food security, boost rural livelihoods, and help combat desertification. Done well, restoration also centers forest communities through supportive policy, including secure land tenure and respect for their ancestral knowledge. Yet globally, the world is still losing more forests than it is gaining. And it can take decades for restored forests to provide the same climatic, ecological, cultural, economic, and social benefits of standing forests.

Photo by Annie Spratt on Unsplash

The Brazilian Amazon has seen steady rates of tree cover gain since 2000, gaining a total of 2.5 Mha of tree cover over 20 years.

Recent policies, including a national plan to recuperate native vegetation and corresponding state-level programs, and commitments, including the Brazilian national bank’s pledge to fund 6 Mha of restoration by 2030, should help galvanize progress.

The Congo Basin saw 2.6 Mha of tree cover gain in total from 2000-2020.

While rates per year appear to be falling, with significant decline from 2000-2005, there are strong calls from within the region for urgent investment in targeted, culturally appropriate restoration initiatives. A holistic approach is needed: one that includes a strong focus on community livelihoods and removing systemic barriers such as unclear land or forest tenure and lack of direct access to finance.

The rate of tree cover gain in Indonesia has declined by nearly 60%, from 1.9 Mha in 2000-2005 to 786,000 hectares in 2015-2020.

Yet in total, tree cover gain in Indonesia was nearly double that of Brazil in this period. Restoration remains central to Indonesia’s 2030 Forest and Land Use (FOLU) “net sink” policy.

Restoration is difficult to measure at a global scale. Here we use “tree cover gain” as a proxy. When combined with data on tree cover loss, it can help give a more complete picture of the net change in forest cover. Data is available as cumulative gain in five-year increments between 2000 and 2020.[15]

3. Greenhouse gas emissions from tropical forest loss

Greenhouse gas (GHG) emissions from tropical forest loss more than doubled over the past two decades, peaking at over 9 billion tonnes of carbon dioxide equivalent (GtCO2e)[16] in 2016 – comparable to the annual emissions from driving about two billion gas-powered passenger cars. Emissions can rise further in years with widespread or intense fires, especially where deforestation and degradation make forests more vulnerable to burning.[17] In recent years, emissions have remained persistently high, at roughly 6-7 GtCO2e per year, equivalent to the emissions of a major industrialized economy.

Although the FPC focal geographies account for nearly half of tropical forests, the GHG emissions of other tropical forest countries also contribute significantly to the pantropical total.

Roughly half of all GHG emissions from tropical forest loss come from forest loss in FPC focal geographies.

Why it matters

Forests release carbon dioxide (CO2) and other GHGs into the atmosphere when cleared, burned, or degraded, but absorb only CO2 when they are kept standing or regrown. Deforestation, forest degradation, and other land-use changes contribute approximately 10-12% of global GHG emissions, and average annual emissions from loss of tropical forests, including but not limited to deforestation, are substantially higher than those from loss of subtropical, temperate, and boreal forests combined.[18]

Photo by Kate Evans/CIFOR

The Brazilian Amazon remains one of the largest sources of GHG emissions from tropical forest loss, and at times the largest, because of its vast forest extent, high carbon stocks, and the large absolute area of forest loss and degradation.

As deforestation plummeted in the Brazilian Amazon in the mid-2000s, associated GHG emissions also fell, demonstrating how reduced forest loss can translate into major climate benefits. More recent trends show both renewed progress and continuing risk: Brazil’s forest loss declined in 2025, but recent severe drought and widespread fires have shown how forest degradation and climate stress can still drive major emissions even when deforestation is falling. Continued loss and degradation, compounded by drought and fire, threaten to push parts of the Amazon toward a “tipping point,” in which large-scale forest dieback or transition to more degraded, savannah-like conditions could weaken carbon storage, disrupt rainfall patterns, threaten biodiversity and livelihoods, and have impacts far beyond the region.[19]

Despite experiencing an increase in emissions from forest loss since 2001, the Congo Basin’s extensive remaining forests continue to make the region globally important for climate mitigation.

The challenge in the Congo Basin is different from Brazil and Indonesia because it is more preventive: Brazil and Indonesia have already experienced periods of very high deforestation and associated GHG emissions. By contrast, the Congo Basin’s vast forest area is still standing. Rising forest loss could increase emissions and weaken the region’s climate mitigation role over time, making forest conservation vital, even as forests face increasing pressure from agriculture, charcoal production, mining, oil and gas, industrial logging, and infrastructure development.[20]

GHG emissions from forest loss in Indonesia have fallen sharply from the high levels seen in the 2000s and mid-2010s, remaining below 900 MtCO2e per year since 2017.[21]

Although emissions have increased somewhat since their recent low in 2021, they remain far below earlier peaks. Continued pressure from agriculture expansion, mining, and other land-use change could put recent emissions reductions at risk.

Estimates of greenhouse gas (GHG) emissions from forest loss combine satellite observations with field-based measurements and model-based approaches. This geospatial model applies a consistent method across countries, providing comparable estimates of emissions from forests globally. The model uses the same definition of forest as our measure of tropical deforestation.

4. Carbon dioxide removals by tropical forests

Tropical forests are a critical carbon sink, absorbing about 7,000 MtCO2 per year on average from 2001 to 2025—more than they emitted on average over the same period. Compared with average emissions of approximately 5,800 MtCO2e per year, this results in a net removal of roughly 1,200 MtCO2e annually over the 2001-2025 period. However, this overall balance conceals diverging regional patterns: while some tropical forests continue to absorb more carbon than they emit, others are net sources due to ongoing deforestation and degradation.

Why it matters

Forests are an important climate solution, sequestering roughly one-third of carbon emissions associated with human activities. By comparing greenhouse gas (GHG) emissions to removals, we can assess where forests are continuing to serve as “carbon sinks,” removing more carbon from the atmosphere than they emit, or have become “carbon sources,” releasing more carbon than they remove.

Tropical forests in FPC focal geographies collectively absorbed nearly 3,000 MtCO2 per year in gross removals on average from 2001-2025. But this critical carbon sink is under growing pressure from deforestation, fires, degradation and rising temperatures due to climate change. Protecting existing forests, restoring degraded lands, supporting Indigenous Peoples and local communities, and reducing fossil fuel emissions are all essential to maintaining forests’ ability to store carbon and avoid dangerous climate tipping points.

Photo by Ulet Ifansasti/Porticus

In the Brazilian Amazon, forests remove nearly 1,100 MtCO2 per year in gross removals.

Emissions from forest loss were slightly higher in the Brazilian Amazon, making this region a net source of GHGs since 2000. Recent data across the Amazon biome show that forests managed by Indigenous Peoples are strong net carbon sinks, but forests outside Indigenous-held lands are collectively a carbon source.[22]

Forests in the Congo Basin remove about 1,200 MtCO2 per year in gross removals, making the region a major net carbon sink over the 2001–2025 period.

The Congo Basin is responsible for nearly one-fifth of all greenhouse gases removed by tropical forests globally. However, increasing forest loss and associated emissions could weaken this carbon sink over time.

In Indonesia, forests remove about 600 MtCO2 per year in gross removals.

Indonesia has set a target of reaching net negative CO2 emissions in the forest and land-use sectors by 2030. Over the 2001-2025 period, average emissions exceeded average removals by over 300 MtCO2e per year, making Indonesia a net source over the long term. Because this estimate reflects a 25-year average, it may not capture more recent reductions in deforestation and associated emissions, which could be improving the country’s emissions balance.[23]

As with GHG emissions, estimates of forest carbon fluxes combine satellite observations with field-based measurements and model-based approaches. Because carbon removals from forest growth occur more gradually and are more uncertain to estimate annually than emissions, we present an average rate of carbon dioxide removals from 2001 to 2025.

5. Tropical deforestation linked to agriculture

Between 2001 and 2025, tropical deforestation linked to commodity production averaged about 6.7 Mha per year, representing about 90% of all tropical deforestation. Agriculture-linked deforestation has decreased by more than one-third since its historic high in 2016, but it remains the largest driver of forest loss across the tropics. Prior analysis found that seven commodities account for more than half of the deforestation linked to commodity agriculture: cattle, oil palm, soy, cocoa, plantation rubber, coffee and plantation wood fiber.[24][25]

In 2025, about 38% of all deforestation linked to agriculture took place in the Brazilian Amazon, Congo Basin and Indonesia. This share has fallen since the early 2000s, suggesting that agricultural frontiers are expanding across a wider set of forest regions.

Why it matters

Large-scale, unsustainable agricultural expansion, driven by continued demand for food, feed, fiber and fuel, is the most significant driver of tropical deforestation, and therefore of greenhouse gas (GHG) emissions from land use. This causes irreparable harm to nature and people, particularly Indigenous Peoples, local communities and Afro-descendants. At least two-thirds of tropical deforestation for large-scale commodity agriculture is illegal. [26]

Photo by Kate Evans/CIFOR

More than 43 Mha of agriculture-linked deforestation occurred in the Brazilian Amazon from 2001-2025.

Cattle production has been the largest driver of deforestation in the Brazilian Amazon, followed by soy. Forest conversion to pasture is driven by a mix of economic, social and political factors, including land speculation, securing land tenure, and cultural preferences — often even when cattle ranching itself is only marginally profitable.[27] After major peaks in the early 2000s and again in 2016, rates have generally trended downward, despite year-to-year fluctuation. This sharp decline demonstrates that large-scale forest loss can be reduced through a combination of stronger law enforcement, supply chain measures targeting soy and beef, credit restrictions, and expansion of protected areas. However, many of these gains remain fragile because they rely heavily on punitive policies and voluntary corporate action, while positive incentives for sustainable land use have yet to be fully implemented.[28]

Agriculture-linked deforestation in the Congo Basin has nearly tripled since 2001, though rates remain lower than other FPC regions.

Large-scale commodity production is not a significant driver of deforestation in the Congo Basin, where small-scale shifting cultivation for household needs remains more significant. However, expanding agricultural frontiers, infrastructure development, and prospective large-scale concessions could increase future pressure on forests.

Nearly 24 Mha of deforestation in Indonesia was linked to agriculture from 2001-2025, driven primarily by palm oil expansion, along with pulpwood plantations and other commodities.

Annual rates remain well below the highs of the mid-2010s, but Indonesia continues to have a very high share of deforestation linked to commodity production.

The conversion of forest to agricultural land use can be estimated at a global scale by combining data on tree cover loss [29] with data that classifies the dominant driver of tree cover loss.[30] For this measure, agriculture-linked deforestation includes tree cover loss from permanent agriculture.[31]

6. Indigenous Peoples, Afro-descendants, and local communities' forest tenure

As of 2017, IP, AD, & LC had legally recognized rights to 10.1% of the world’s tropical forests, a 54% increase from 2002.

There is wide variety in the degree of tenure recognition across the three tropical forest basins. While in Brazil, nearly one-third (31.9%) of all forest land was designated for use or owned by IP, AD, & LC as of 2017, in Indonesia and most of the Congo Basin, this figure is below one percent. A closer look at each geography reveals further nuance.

Why it matters

Indigenous Peoples, Local Communities, and Afro-descendants lead the most effective solutions to halting and reversing deforestation, as part of a broader, rights-based approach to combating climate change. The evidence base is strong, and growing: when their territorial rights are recognized, secured, and protected, deforestation is lower[32], carbon stocks are higher[33], and biodiversity is protected.[34][35]

Photo by Ulet Ifansasti/Porticus

In Brazil, forest land designated for use by IP, AD, & LC has nearly quadrupled, from 10.7 Mha in 2002 to 40.4 Mha in 2017.

Forest land owned IP, AD, & LC also grew from 75 Mha in 2002 to 118 Mha in 2017. Nearly half of all forest land under this category across Latin America can be found in Brazil.[36]

Rights are recognized to less than 0.5% of each country’s forest land in the Congo Basin, except for Cameroon, where 3.6 Mha is designated for use by IP & LCs.[37]

While this represents some progress since 2002, the recognition of communities’ forest rights in Africa continues to lag behind progress made in Asia and Latin America, despite positive steps by some countries.

As of 2017, just 790,000 ha of forest land was designated for use by IP & LCs, up from 220,000 in 2002. An additional 100,000 ha is fully owned by IP & LCs.

In 2013, Indonesia’s Constitutional Court ruled that Indigenous Peoples have the right to manage the forests in which they live. Since then, the government has committed to recognizing 12.7 Mha of forest land, but progress has been slow.

Forest tenure is at its core, a local and legal instrument. Like any global metric, it is difficult to apply a consistent approach. This measure adopts a tenure tracking method developed by the Rights and Resources Initiative (RRI) that classifies tenure in four categories: government administered, privately owned by individuals and firms, and either owned by or designated for IP, LC & ADs.[38]

7. Social progress

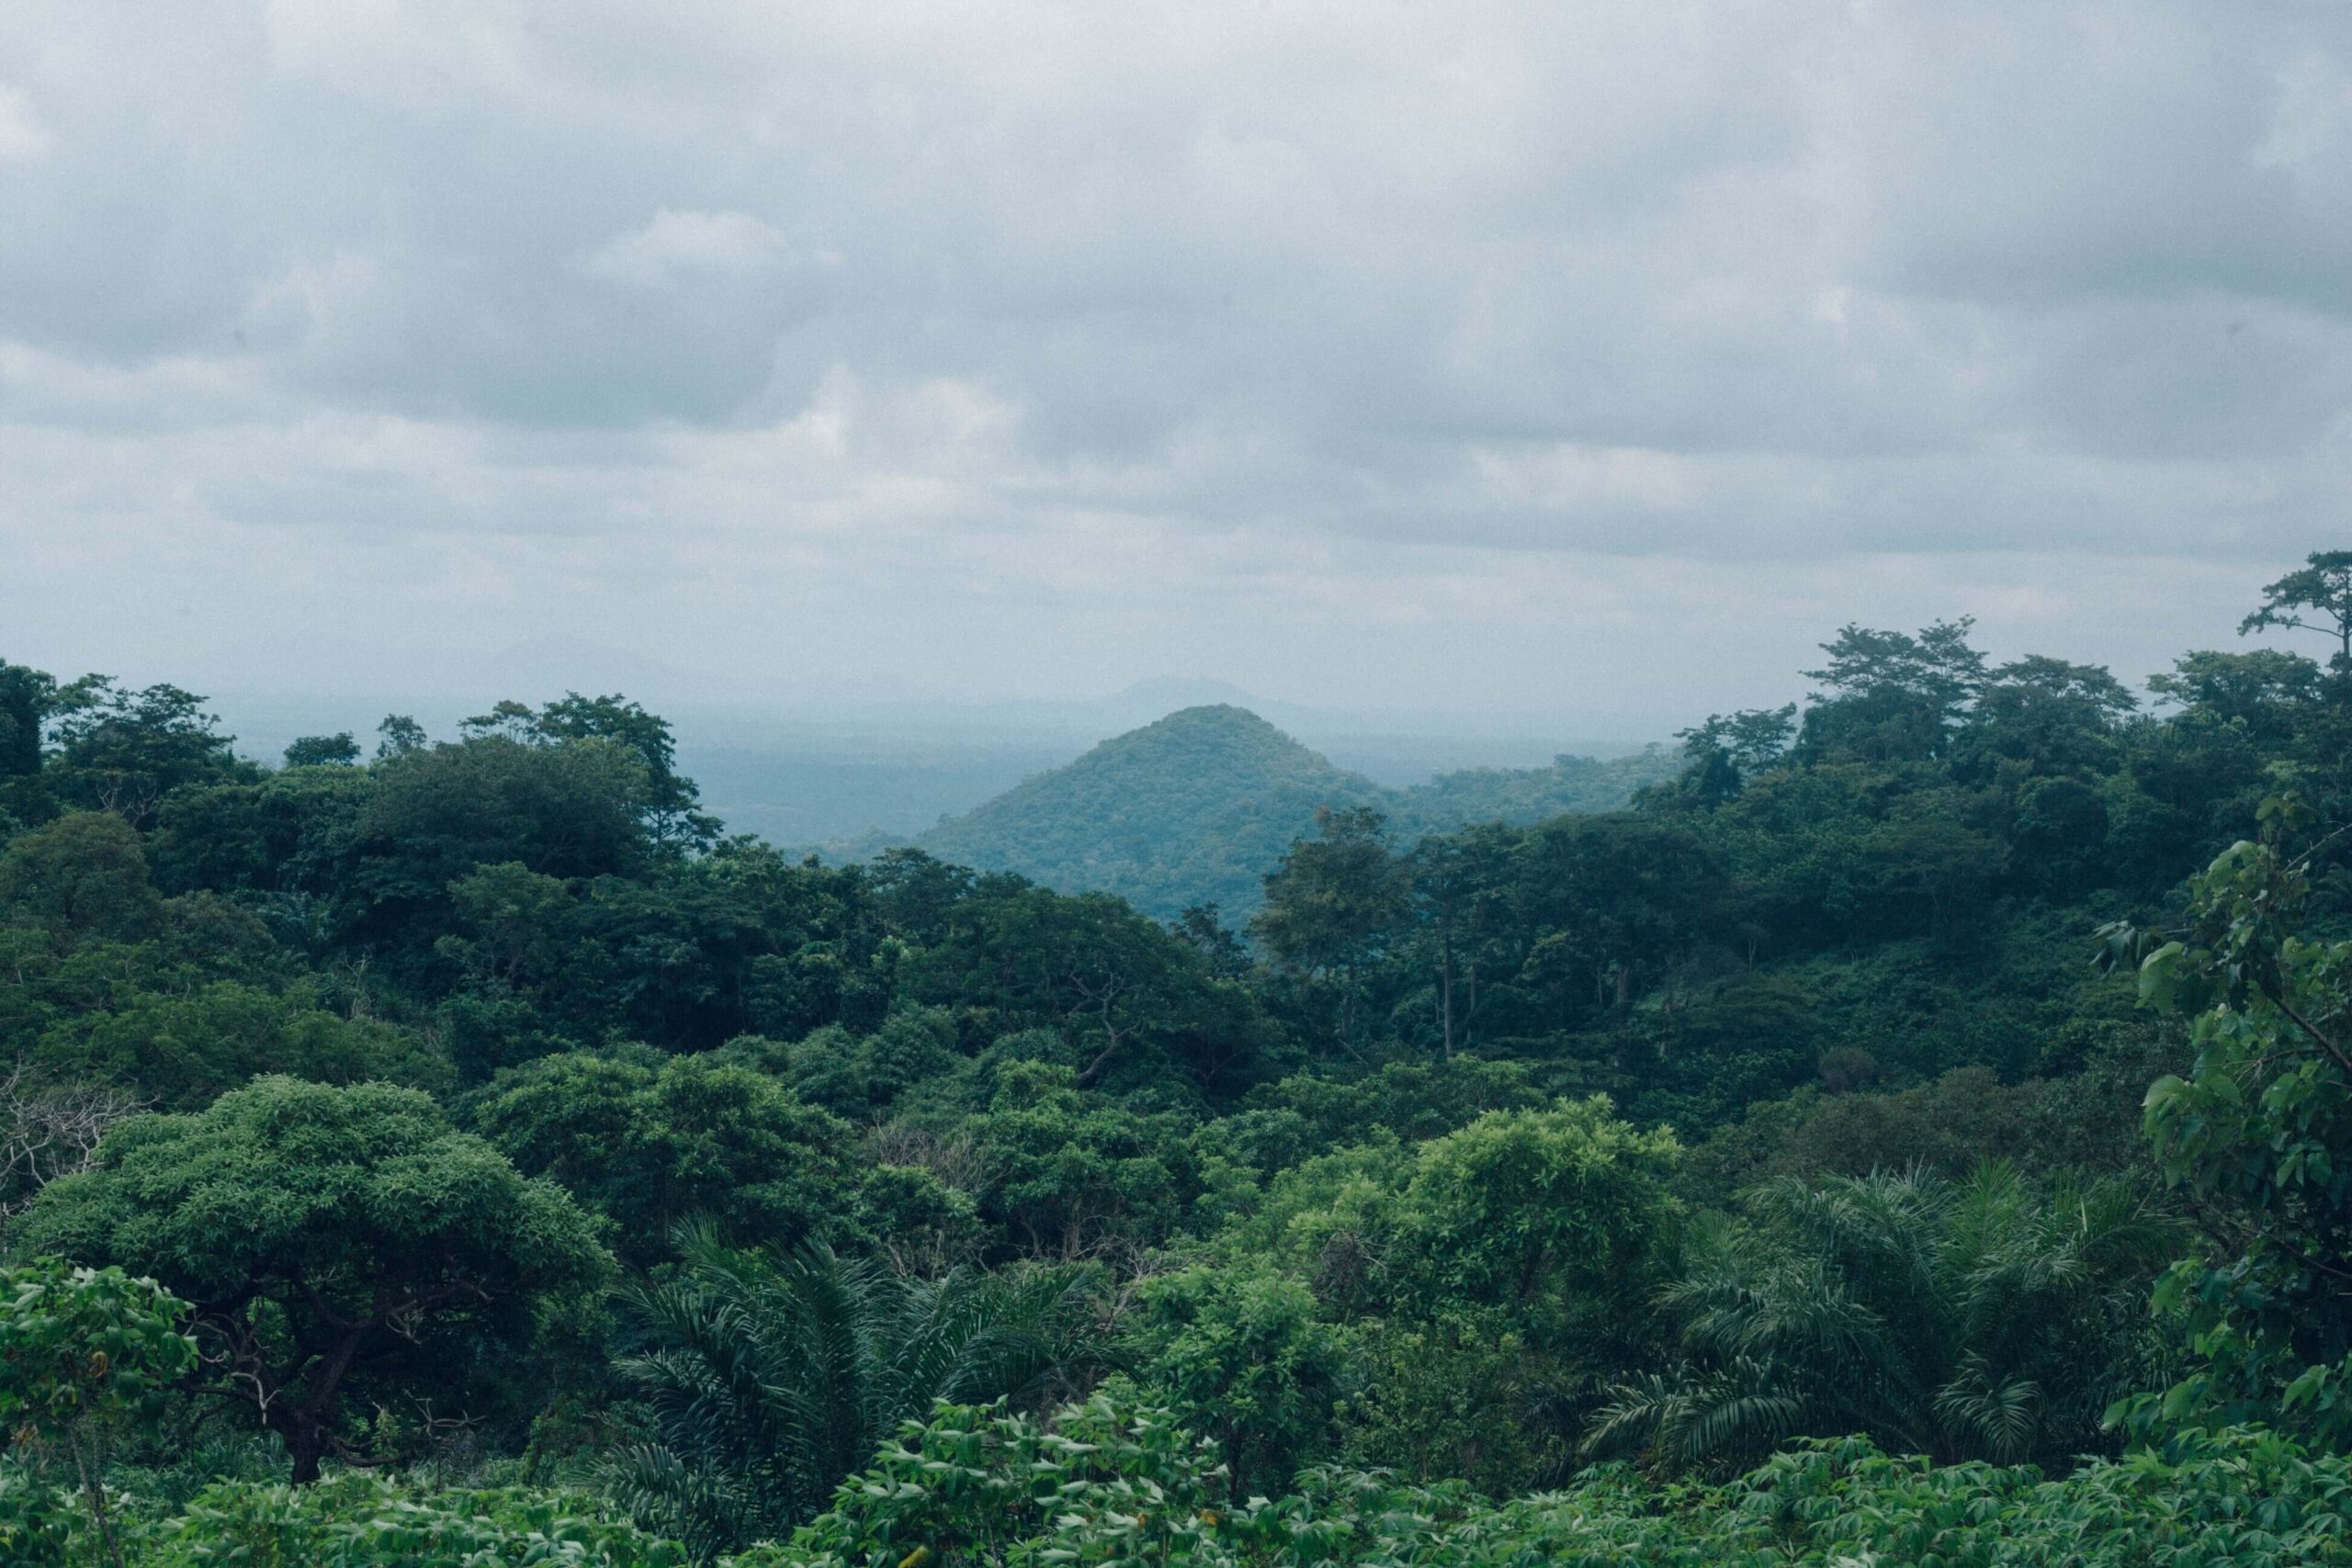
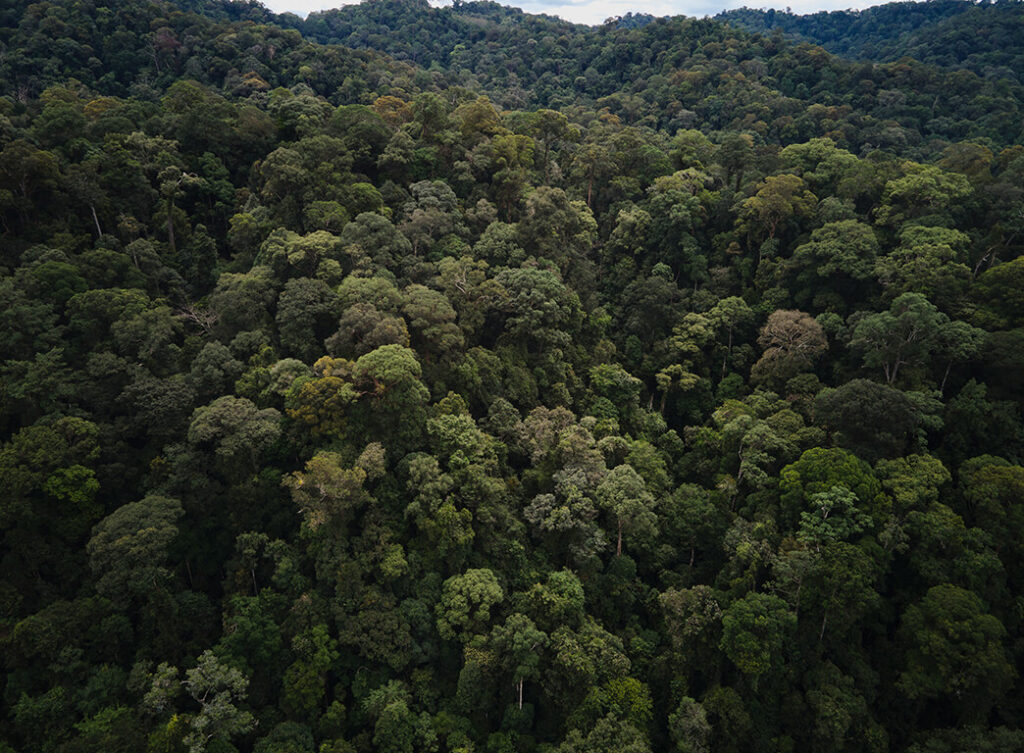
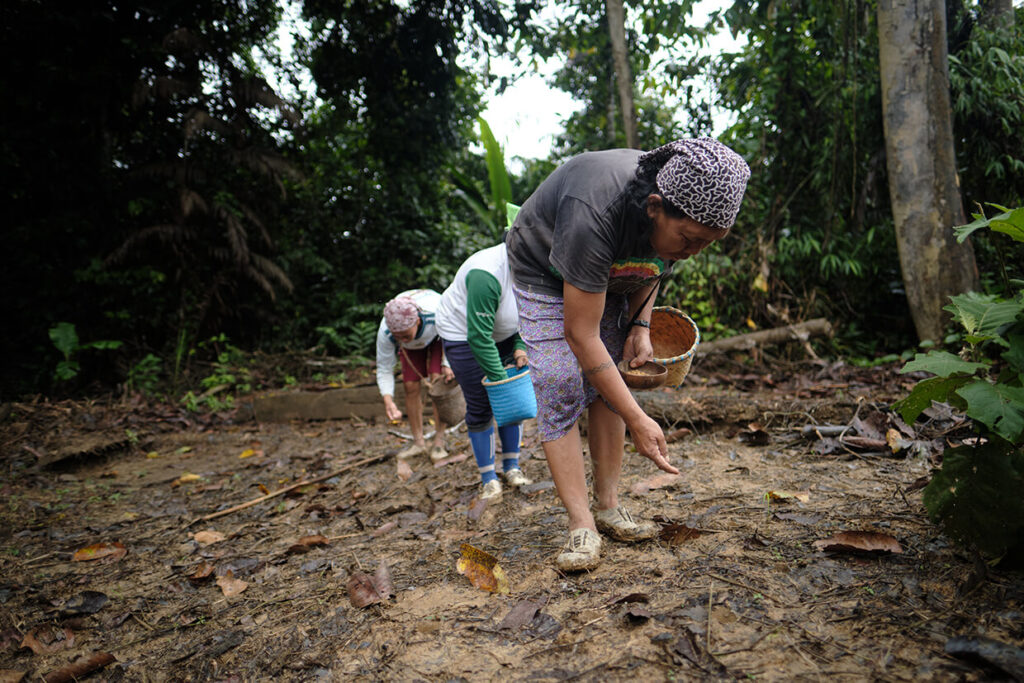
Halting and reversing deforestation must be advanced alongside sustainable development, recognizing that lasting benefits for nature depend in part on society’s ability to meet people’s needs and support their wellbeing. The Social Progress Index (SPI) measures the lived conditions of a society (basic needs, wellbeing and opportunity) separately from economic output, recognizing that GDP alone doesn’t necessarily reflect whether people have what they need to thrive.

Across tropical forest countries, SPI has improved over the past decade, but gains have slowed recently, in line with a broader global slowdown. FPC focal geographies have also improved and, while not mirroring that slowdown, continue to lag behind the rest of the tropics and the pantropical region as a whole.

Why it matters

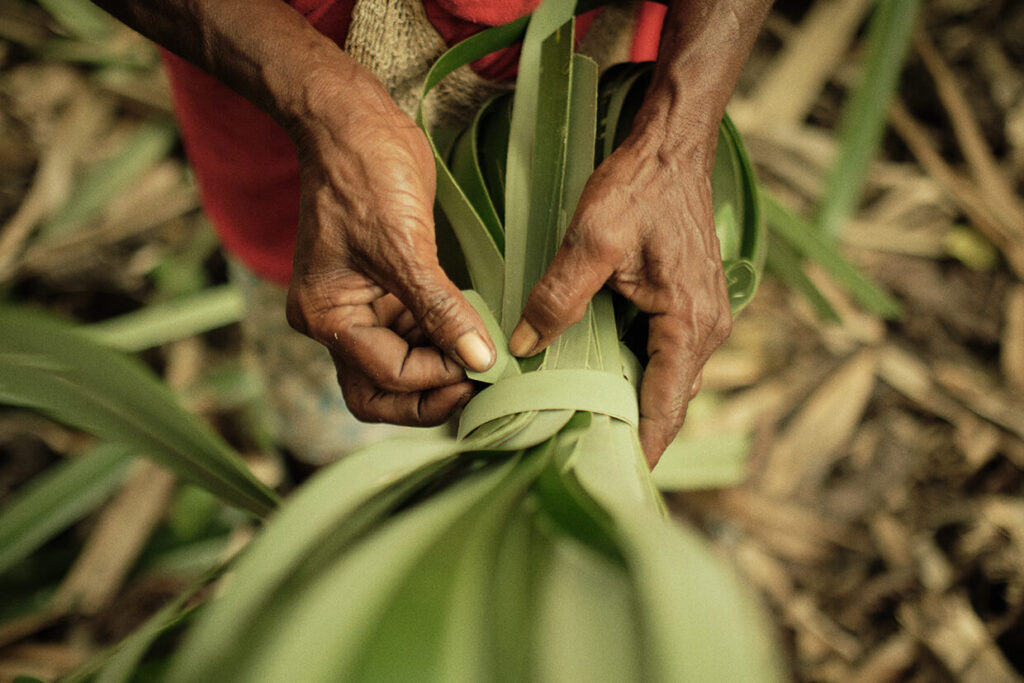
Around the world, economic growth has often come at the expense of forests and local communities. FPC’s goal is to both halt and reverse tropical deforestation and support just, sustainable development. The Social Progress Index helps look beyond income to assess basic needs, wellbeing, and opportunity – conditions that shape people’s ability to pursue secure livelihoods, participate in decision-making, and support sustainable forest stewardship. Such progress is essential in the regions where many of the world’s remaining tropical forests stand so that communities can thrive while keeping forests intact.

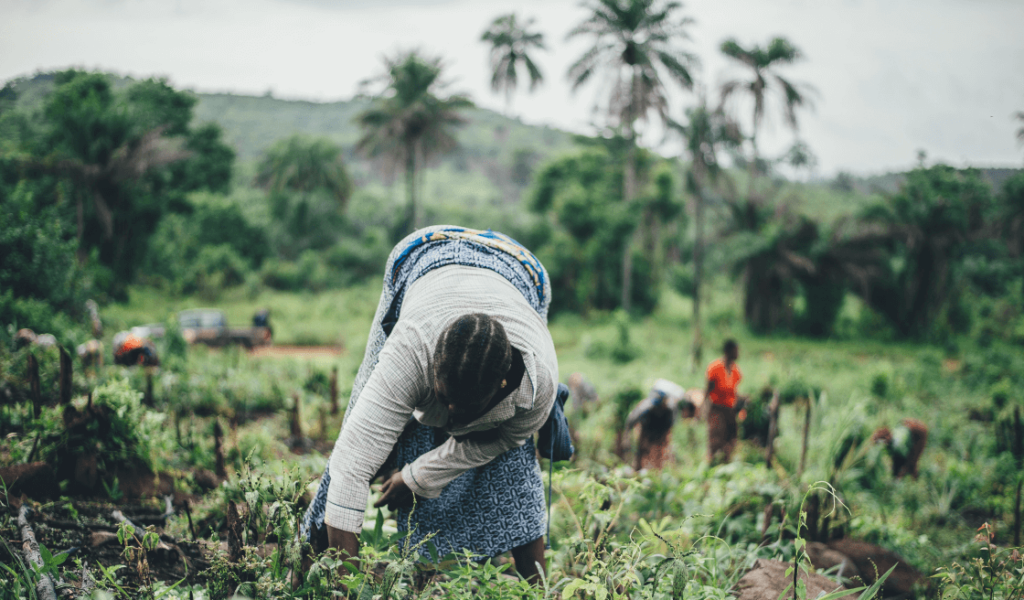
Photo by Michael Padmanaba/CIFOR

Within geographies where FPC focuses, however, there is considerable variation in both social progress levels and rates of change.

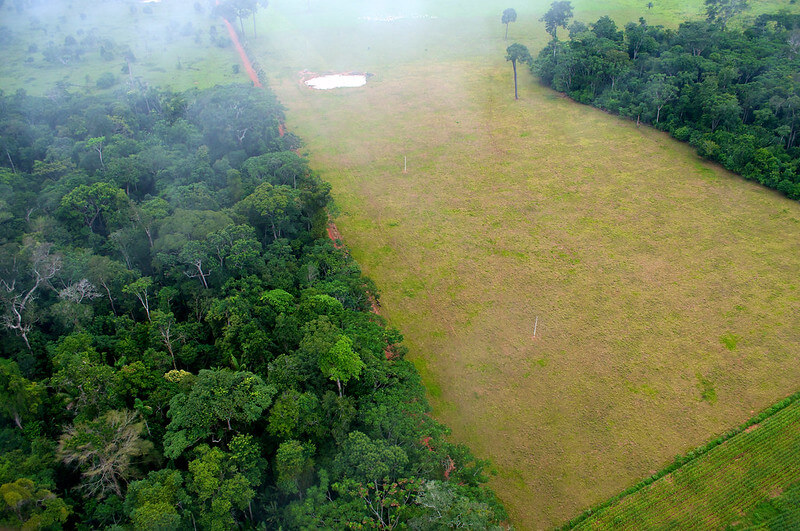
The Brazilian Amazon continues to lag behind the national social progress average.[39]

Safety is a persistent challenge across much of the Brazilian Amazon, and Freedom & Choice also performs poorly. Environmental quality is the region’s weakest component, reflecting concentrated deforestation, suppression of secondary vegetation, high associated greenhouse gas emissions and limited urban green areas. Health outcomes appear relatively stronger in parts of Pará and Amazonas, though this does not offset broader deficits across other SPI components.

Social progress in the Congo Basin has improved modestly since 2011 but remains lower than in other geographies where FPC focuses.

There is considerable variation within the region, from the Central African Republic (lowest) to Gabon (highest). Opportunities (including rights, freedoms, inclusion and access to advanced education) remain weak across the Congo Basin, while basic needs such as nutrition, water and sanitation, housing and safety are also especially constrained in the Democratic Republic of the Congo (DRC) and the Central African Republic.

In Indonesia, social progress has improved by about 14% since 2011, though progress remains uneven across dimensions and geographies, including in forest frontier areas.

SPI scores are the strongest for basic needs and weakest in opportunity, particularly in areas related to advanced education, inclusion and individual freedoms. Housing remains the highest scoring component, while advanced education (including academic freedom and women in higher education) and inclusive society (including discrimination and violence against minorities) remain the lowest-scoring.

SPI is a people-centered measure of social progress focused on non-economic aspects of basic needs, wellbeing, and opportunity. It combines 57 social and environmental outcome indicators into an alternative to traditional measures of economic performance such as GDP. For the Brazilian Amazon and Amazon-state values, SPI scores were calculated as simple averages of SPI Brazil municipal scores for municipalities within the Legal Amazon and within each Amazon state, rather than as population-weighted averages of municipal SPI scores used by SPI Brazil / IPS Brasil.

8. Civil society rights: freedoms of assembly, association, and expression

Sustainable forest protection depends on active and protected space for civil society, yet civic space remains constrained in most tropical forest countries.

Across FPC focal geographies, the CIVICUS Monitor rates Brazil, Indonesia and Gabon as “obstructed,” meaning civil society faces significant legal and practical barriers, while Cameroon, the Central African Republic, the Democratic Republic of the Congo (DRC), and the Republic of the Congo are classified as “repressed,” where restrictions on association, assembly and expression are more severe and routinely enforced, with significant risks for opposition figures.

Recent trends are also concerning: in 2025, Indonesia and DRC were placed on the CIVICUS Watchlist, a designation given to countries with rapid civic space deterioration. From FPC focal geographies, only Gabon improved its rating from repressed in 2024 to obstructed in 2025. Together, these trends underscore the increasingly challenging operating environment for Indigenous Peoples, local communities and civil society organizations working to protect forests and hold governments and companies

Photo by J Sidle

Why it matters

Some of the most effective movements to protect the world’s forests are those led by, and accountable to, the people most directly affected by deforestation. But the current infrastructure aimed at halting and reversing deforestation remains too disconnected from these actors and insufficient to support their efforts, even as they face growing threats. Civic space is a key enabling condition for civil society to defend rights, access resources, respond to threats to forests and people, and pursue self-determined development. It is therefore foundational to FPC.

In Brazil, CIVICUS continues to document serious concerns about freedom of expression, including harassment, threats, and judicial pressure targeting human rights defenders, journalists and critics.[40]

Illegal deforestation and mining, and the illegal seizure of land as well as associated violence, continue to threaten Indigenous and other forest-dependent communities, even as enforcement has strengthened in recent years. Brazil remains the second-most dangerous country in the world for land and environmental defenders, with 18% of the killings and disappearances tracked globally between 2012 and 2024 occurring in Brazil.[41]

Cameroon, the Central African Republic, the Democratic Republic of the Congo, and the Republic of the Congo are rated as repressed by the CIVICUS Monitor, while Gabon improved from repressed to obstructed in 2025.

These ratings point to significant constraints on civil society rights across much of the region, with risks for activists, journalists, environmental defenders, and community organizations working on forest and land issues. Civil society organizations in several Congo Basin countries face limited funding, capacity constraints, and restrictive civic conditions that can weaken their ability to advocate for forest protection and community well-being. Political instability, conflict, displacement and weak governance in parts of the region can further heighten risks for communities and civil society actors.

In Indonesia, civic space remains obstructed and uneven.

In 2025, CIVICUS placed Indonesia on its Watchlist, citing rapid deterioration in civic space and concerns about restrictions on activists, protest, and legal protections. These legal and political barriers can limit civil society’s ability to monitor and challenge forest exploitation, mining expansion, and other resource governance concerns.[42]

One of the many global indices measuring some degree of civic space, the CIVICUS Monitor analyzes the extent to which the three civil society rights — freedom of peaceful assembly, freedom of association and freedom of expression — are being respected and upheld. It also assesses the degree to which states protect these freedoms. CIVICUS combines independent qualitative and quantitative data from a range of sources via standard calculations and verification checks, and rates each country as: open, narrowed, obstructed, repressed or closed.

9. Finance commitments to protecting and restoring forests

UNEP estimates that total public and private forest finance reached US$84 billion globally in 2023. This is far below the estimated US$300 billion needed to keep forests standing by 2030.[43]

Much of this finance comes from domestic public budgets, such as government spending on forest protection, management, or enforcement. Yet UNEP shows that only a limited share of this spending was allocated within tropical forest countries. Smaller shares of total forest finance come from international public sources and private finance, including impact investment, carbon markets, philanthropy, and certified commodity supply chains.

Recent pledges from governments, philanthropy, financial institutions, businesses and multistakeholder partnerships show some progress, but at a smaller scale. Since 2021, key forest finance pledges and initiatives tracked by the Forest Declaration Assessment have totaled US$30.7 billion, of which US$15.1 billion had been disbursed as of September 2025.[44]

Why it matters

Significant finance is needed at scale to halt and reverse deforestation. Recent estimates suggest annual finance flows to forests must increase from US$84 billion in 2023 to more than US$300 billion by 2030.[45] Given the substantial economic benefits that standing forests provide — including carbon sequestration, climate regulation, watershed protection, biodiversity, ecotourism and sustainable livelihoods — this investment can pay dividends. At the same time, increasing finance alone will not be enough. Lasting progress also requires shifting the underlying economic and political incentives that continue to drive forest loss, including redirecting finance away from harmful activities and toward forest protection.

Photo by Kynan Tegar

Figures of commitments and disbursements draw on Climate Focus analysis for the Forest Declaration Assessment of key forest finance pledges and initiatives from 2021–2025. They track publicly reported commitments and disbursements from governments, philanthropy, financial institutions, businesses and multistakeholder partnerships through September 23, 2025.

10. Public funds channeled towards harmful activities put forests at risk

Global agricultural subsidies have doubled since 2000, reaching $631 billion in 2021 for the economies tracked by OECD. This figure could reach $1.8 trillion per year by 2030 if current trends are not reversed.[46] The UN estimates that total public “gray” (nature-negative) finance in 2022 was almost $1.7 trillion per year, more than 10 times the rate of public “green” finance.[47] Governments should phase out harmful subsidies, and repurpose them towards nature-positive food systems.

Why it matters

A transformation of public investment that harms forests is needed to shift incentives that favor deforestation, currently underpinned by a viewpoint that conservation is an impediment to economic growth. Given the role of agriculture as the largest driver of deforestation, we focus on agricultural subsidies. These are designed to improve food security and economic growth but can catalyze unsustainable land use, market distortion, and expansion into forestland, in many cases with adverse effects on local livelihoods and human health.[48]

Photo by Kynan Tegar

The Organization for Economic Co-operation and Development (OECD) has tracked public agricultural support, defined as “the annual monetary value of gross transfers to agriculture from consumers and taxpayers arising from government policies”, since the 1980s. This is used as a proxy for “grey” finance, defined broadly as investments with negative impact on nature.[49]